Have you ever wanted to visualize the structure of a Keras model? When you have a complex model, sometimes it's easy to wrap your head around it if you can see a visual representation of it. What if there's a way to automatically build such a visual representation of a model?
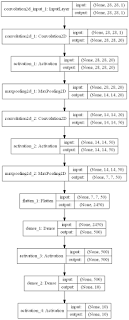
Well, there is a way. Keras has a model visualization function, that can plot out the structure of a model. It would look something like this,
 |
| The visualization of the LeNet model |
Above is the visualization of the LeNet model, which is defined in code as follows,
 # initialize the model
 model = Sequential()

 # first set of CONV => RELU => POOL
 model.add(Convolution2D(20, 5, 5, border_mode="same",
     input_shape=(height, width, depth)))
 model.add(Activation("relu"))
 model.add(MaxPooling2D(pool_size=(2, 2), strides=(2, 2)))

 # second set of CONV => RELU => POOL
 model.add(Convolution2D(50, 5, 5, border_mode="same"))
 model.add(Activation("relu"))
 model.add(MaxPooling2D(pool_size=(2, 2), strides=(2, 2)))

 # set of FC => RELU layers
 model.add(Flatten())
 model.add(Dense(500))
 model.add(Activation("relu"))

 # softmax classifier
 model.add(Dense(classes))
 model.add(Activation("softmax"))
The documentation page of the Keras Visualizer states that you just need 2 lines of code to plot a model,
 from keras.utils.visualize_util import plot
 plot(model, to_file='model.png')
Sounds easy right? But, as soon as you try to run, you learn that you need to setup few dependencies in order for it to run. Basically, you need to,
- Install graphviz Python package, and the graphviz binaries added to the PATH.
- Install pydot Python package
- Fix a bug in the Visualization module in Keras
The graphviz conda package only contains the binaries, and not the Python bindings. The pip package for graphviz only has the Python bindings and not the binaries. So, we need to install both.
First, install conda package,
conda install graphviz
This places the graphviz binary files in to the <path to anaconda environment>\Library\bin\graphviz\ directory. So, you need to add it to the system PATH.
Then, we install the graphviz pip package,
pip install graphviz
Then, we install pydot from pip,
pip install pydot
Then, we need to do an edit in the Keras Visualization module. There is a bug in that code, which doesn't work with the latest version of pydot.
Open the <path to anaconda environment>\lib\site-packages\keras\utils\visualize_util.py file, and comment out the following block,
 #if not pydot.find_graphviz():
 #  raise ImportError('Failed to import pydot. You must install pydot'
 #           ' and graphviz for `pydotprint` to work.')
The pydot.find_graphviz() function does not exist in the latest version of pydot.
After these steps are done, you should be able to import the visualize_util and run the plot function to generate the visualization.
Try fiddling with the show_shapes and show_layer_names parameters in the plot function to see how it changes the generated graph.
Related links:
https://keras.io/visualization/
Build Deeper: Deep Learning Beginners' Guide is the ultimate guide for anyone taking their first step into Deep Learning.
Get your copy now!


Thanks for the neatly explained article. I had to do a few more steps though.
ReplyDeleteThe additional steps are as below:
I installed graphviz from here http://www.graphviz.org/Download_windows.php and added C:\Program Files (x86)\Graphviz2.38\bin to PATH
Next I did:
conda install pydot-ng
And finally in my notebook I added the two lines below.
import os
os.environ["PATH"] += os.pathsep + 'C:/Program Files (x86)/Graphviz2.38/bin/'
Nice!
DeleteI was never able to get the 'pydot-ng' package to work, which is why I used the 'pydot' package instead.
Thanks for showing how to get it to work :)
thumbs up... great
DeleteI went to http://www.graphviz.org/Download_windows.php but the page cannot be found :'(
DeleteLooks like the Graphviz website got updated. Here's the updated link to the page: https://graphviz.gitlab.io/_pages/Download/Download_windows.html
DeleteBut the graph I generated doesn't have the input and output shapes for each layer. Do you have any idea why is this so? I am not able to add the picture here.
ReplyDeleteAh! I see that I've missed it in the code I've posted.
DeleteYou ca use the show_shapes parameter of the plot function to enable that. Like this:
plot(model, to_file='model.png', show_shapes=True)
There's another parameter, 'show_layer_names' which by default is set to 'true'. You can set it to 'false' if you don't want the layer names in the output.
Thanks again! works like a charm :)
DeleteHi I receive an error as 'TypeError: argument of type 'bool' is not utterable'
ReplyDeleteThanks for your time in advance.
Hi,
Deleteit looks like both Keras and Theano has changed the visualization functions in the latest versions.
I'm working on updating the tutorial for the latest changes. Will have it up soon.
No working still the same error :(
ReplyDeleteIs there an option to visualize the individual nodes and connections instead of just layers as boxes?
ReplyDeleteThank you, this was really helpful
ReplyDelete